If there’s one thing we’ve learned over the past few years, it’s that you can never have enough data.
Some of the most prominent and important projects that are being worked on for the Members of Nationwide Marketing Group revolve around the use of data. The numbers the data team analyzes come in all shapes and sizes, but the end goal remains the same: How can we take that information and produce something actionable that Members can use to improve their business?
Hard data – like point of sale, sell-in and sell-through – are important in that process. But they’re only a fraction of the equation. We also need to understand what Members may or may not be feeling and seeing on the frontlines of retail throughout the course of a given month or year. How are you doing against your individual sales goals? What product categories do you think will be easiest to sell this month? How well will you be able to drive traffic to your store or website? Those are exactly the types of questions we’re looking to answer with the NMG Independent Retail Confidence Index (we’ll call it the NMG Index, for short).
In July, Nationwide launched the first-ever NMG Index survey, and the response rate was nothing short of exceptional. Similar to other confidence indexes you may see in the market, the NMG Index is intended to provide a broad overview of a given audience’s perspective on current market conditions – in this case, Independent retailers. It’s just one more way for Nationwide to keep its finger on the pulse of our Membership and the wider Independent retail channel.
Like any new report, the numbers may not mean much right out of the gate. However, over time, this index will allow us to track a number of trends, which in turn will enable Nationwide to improve offerings in a number of areas.
How It Works
The NMG Index pulls survey responses from Members together into an algorithm that produces an overall “confidence score.” The survey involves a series of scaled rating questions, i.e. “On a scale of 1 to 10,” which Nationwide then aggregates. The questions allow us to get that overall score, but the real fun comes when we parse through the individual questions.
The survey will regularly include questions about retailers’ confidence in selling different product categories, their ability to drive e-commerce conversions and more. So, while we can follow the NMG Index score over time, we’ll also be able to see how those product categories and other indicators trend throughout the year.
A “perfect score” for the NMG Index — one where all respondents indicated their confidence was at the absolute highest — works out to be 281. On its own, that number certainly doesn’t mean much. But, as mentioned, we’ll be able to see how the NMG Index increases and decreases month-over-month and year-over-year.
In this first survey, Nationwide Members collectively produced an NMG Index score of 192.52. That works out to 68.5%, which if viewed like a scale would mean they’re firmly tipping towards more confident.
Without knowing any type of trending data, and understanding that this survey was conducted in the middle of a global pandemic, that figure would seem to point to a rather positive overall sentiment among Independent retailers. We’ll understand more over time, but it appears as though we’re off to a strong start with the NMG Index.
The way we conduct this survey also allows us to break out confidence scores by primary store type. Knowing that 192.52 is how the industry as a whole scored, here’s a look at the breakdown by store type:
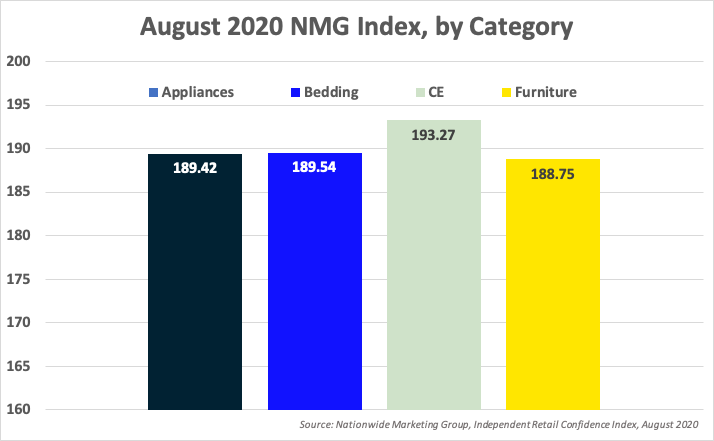
What we see here is a relatively flat breakdown by store type. Consumer Electronics dealers stand out with a slightly higher score, which may not come as much of a surprise with the increase in demand for CE-related products during the COVID-19 lockdown.
Product Confidence
Digging deeper into the survey, we’ll regularly get a glimpse into retailers’ confidence levels across 18 different product categories each month. And when they’re simplified to a scale of 1 to 10, the results here are a little easier to understand.
Here’s a glimpse at the results from this first NMG Index survey:
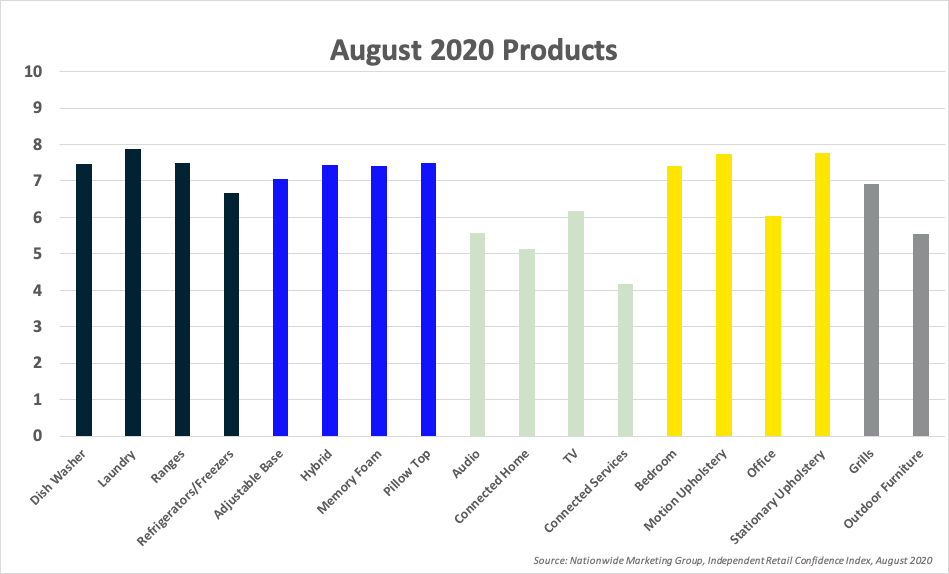
Interestingly, although Consumer Electronics retailers were more confident as a store type, their products collectively rank lower than other categories for which we surveyed. That may speak to other retailers’ lack of confidence in their ability to push CE products when CE is not their main area of focus.
Sales Goal Performance
Another aspect of this monthly report is the ability for retailers to report their performance against previous months’ sales goals. Nationwide is able to view hard sell-through data, but what that doesn’t show us is whether or not a retailer hit their goal. This survey corrects for that, and early signs from this first NMG Index survey were beyond positive.
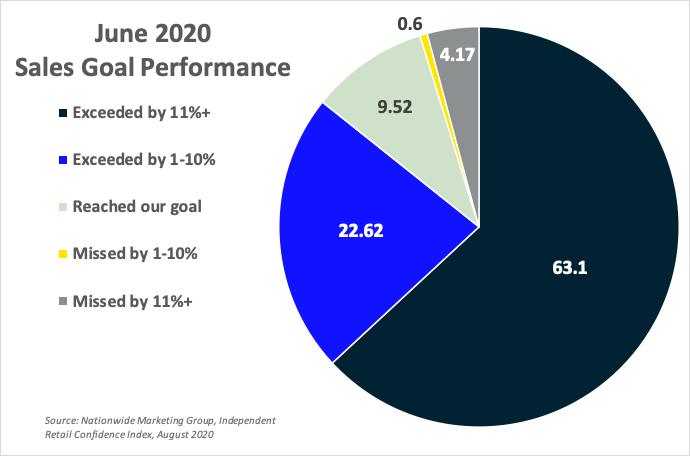
Of those Members who responded, more than 85% exceeded their sales goal for the month of June. Another 9.5% achieved their sales goal, while less than 5% missed their June goal.
If you are interested in participating in the monthly NMG Index survey, you can sign up right here to have the survey delivered directly to your email.

